PassMark PerformanceTest 10 Run on 12 Graphics Cards
PassMark PerformanceTest 10 Examined and Tested
We’ve noticed PassMark PerformanceTest 10 results in the news quite a bit over the past month or so. Just before AMD’s Zen 3 processors came to market someone ran PassMark on the AMD Ryzen 5 5600X desktop processor and uploaded the results to their online database. That made news headlines around the world as the AMD Ryzen 5 5600X was nearly ten percent faster than the Intel Core i9-10900K processor. It showed that AMD was about to become the single-threaded performance leader, which they did when the processors came out last week.
PerformanceTest has been around for more than two decades and is one of the easiest full system PC benchmarks that you can run. Once you have run the test you can then compare your results with over a million computers submitted by other PerformanceTest users around the planet. The benchmark measures CPU, GPU, Memory and storage drive performance to give you a good idea on how the hardware in your system performs. We’ve used PassMark software off and on over the 18 years that Legit Reviews has been around, but we have yet to use PerformanceTest 10 on the site. After seeing PassMark in the headlines we figured we’d download PerformanceTest 10 and try it out for inclusion in our test suite.
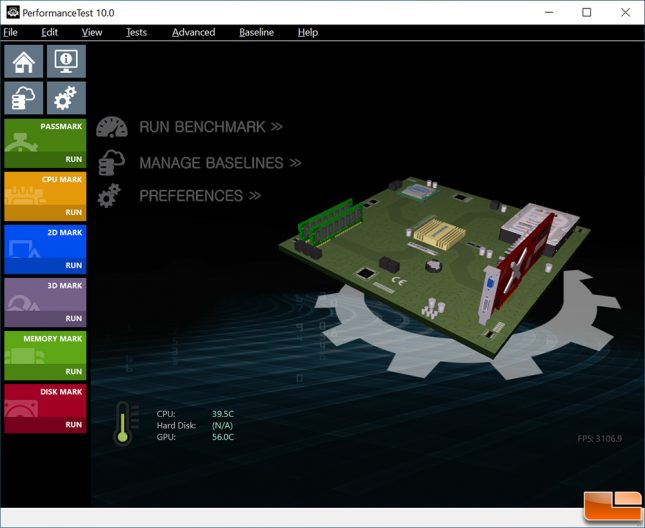
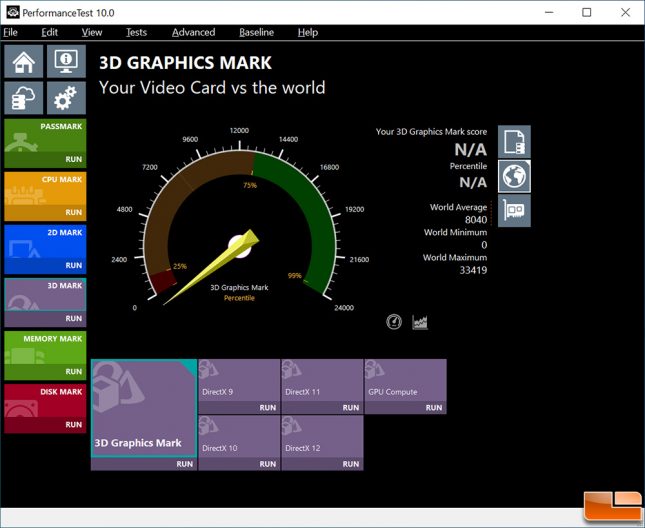
The GUI for PerformanceTest 10 is super easy to follow and you can quickly run all the tests or test a specific area that might be of interest to you. We wanted to look at 3D performance on the upcoming AMD Radeon RX 6000 series against the NVIDIA GeForce RTX 30-series cards, so we picked to run the full 3D Mark test suite.
Legit Reviews interview questions with PassMark
1) There are a number of synthetic benchmark utilities for graphics cards on the market. What makes PerformanceTest different with regards to the 3D graphics tests?
Convenience. It is fast to download, fast to run, free to try, covers both older low spec machines and new high end machines. I dont think there are many (if any) other benchmarks that covers DirectX9, 10, 11, 12, DirectCompute & OpenCL in a single package.
2) What game engine is used for this benchmark? Will it provide meaningful results for those reading reviews seeking information before they purchase their next graphics card?
On Windows the 3D code was largely based on Microsofts example DirectX code. For each new DirectX release Microsoft publish examples of what they think it best practice (or at least good practice). For the older Direcxt9 & 10 SDKs these are now probably lost in the mists of time, as DirectX9 was released in 2002 (but it is still in common use despite this). The current DirectX12 code examples are available however. See,
https://github.com/microsoft/DirectX-Graphics-Samples
https://docs.microsoft.com/en-us/windows/win32/direct3d12/directx-12-programming-guide
In many cases Microsoft also provided a helper library. Or what they are now calling a Mini Engine on the page above.
The possibility of using a commercial engine was examined, and we even did prototypes. But it would have meant a 20x increase in the installation package to get the same API coverage. There was also a corresponding increase in complexity and cost. We were originally known for having a benchmark that would run from a floppy disk (i.e. a ~1MB download) and to then make the package an enormous, AAA game sized package, went against our ethos.
Note: On Android and iOS versions of PerformanceTest we are using Unity for one of the 3D tests (as on mobile devices Unity is fairly small).
3) The 3D test in your benchmark runs very quickly and some hardware might be in a boost state for the entire duration of your test. Does the short nature of this accurately show the performance of the hardware being tested?
You can adjust the test duration and number of iterations from the Preferences window. So the user can choose what they measure. Most people would run the default settings however. There is no one right benchmark. If you are using a video card for rendering or CAD/CAM, then load on the video card might also come in short bursts. So there are going to be a spectrum of results based on the way the computer is used. But yes, machines with great cooling might run for longer at a higher speed and score better. (But that is the purpose of having great cooling, isnt it).
4) How many CPU threads is PerformanceTest 10 coded to use?
Depends on the test. All of the CPU tests run 1 thread per available core by default (except the single threaded test). The 3D tests typically have 2 or 3 threads. We dont need as many threads as a AAA 3D game as we arent doing all the same stuff that a game that would normally do to keep more threads busy (e.g. no AI, no sound, no pathfinding, ). Disk tests are 1 thread. Memory tests are 1 thread, except for the multi-threaded tests. 2D tests are 1 thread.
5) Have you taken development money from any corporations?
We have ~107,000 paying customers. This includes all the major IT firms. Microsoft, AMD, Intel, Google, Facebook, ASUS, Lenovo, Dell, NASA, HP, ASRock, Samsung, Apple, etc.. We also earn some indirect revenue from Ads running on our web sites. While we have sold software and hardware to these firms, there was no payment for development on PerformanceTest. Income from the sale of our hardware and software goes into general revenue and we decide internally when and what we develop.
We do also develop bespoke benchmarks and do software customization as consulting work. A recent example was development of tools and methods to measure speeds for cloud backup services. Other example is customization of Memtest86 for Apacer. These arent part of PerformanceTest however.
6) Do you feel like PassMark PerformanceTest 10 is an unbiased benchmark?
Yes. I wrote the original code myself, and have overseen the development for 22 years. So I know there is no bias (in the sense that there was never a deliberate effort made to favor one company over another). But some algorithms naturally favor certain hardware. There is no single benchmark number that can accurately reflect the performance of all real world software on all possible hardware. There is too much variation in the software and hardware ecosystem to simplify everything to a single number. So people need to look at a wide range of benchmark results.
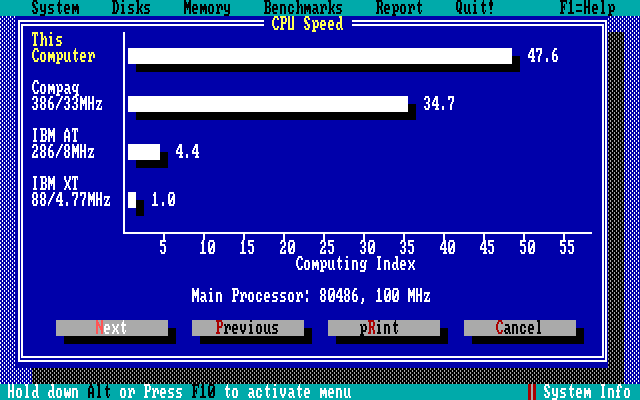
BTW: The original inspiration for version 1 of PerformanceTest was the Norton Utilities System Info tool (Shown above) from the 1980s.
7) Do you have any future plans that you can talk about regarding PerformanceTest?
Yes. We are developing an ARM IoT version of the CPU benchmark test (Linux command line). This is just about done. Then after that we are planning on doing a Windows ARM release (native code, not emulated). Our hope is to significantly expand the cross platform benchmark reporting here
https://www.cpubenchmark.net/cross-platform.html
How We Used PerformanceTest 10 For Testing Desktop Graphics Cards
For our testing we used PerformanceTest 10 at the default settings and ran the 3D Mark test. Each test pass takes approximately 3.5 minutes to complete. We ran 12 difference graphics cards from both NVIDIA and AMD. All of the cards were either Founders Edition or reference models and the clock speeds were left stock.
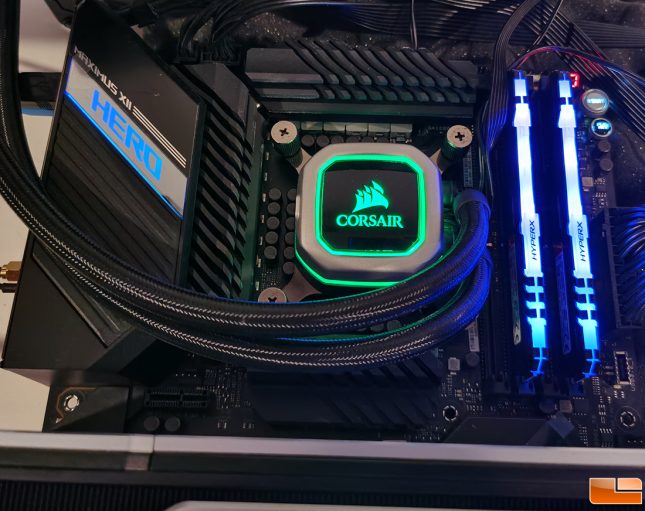
Legit Reviews Test System Specifications
- CPU: Intel Core i9-10900K 10-core – buy from Amazon
- Motherboard: ASUS ROG Maximus XII Hero Z490 – buy from Amazon
- CPU Cooler: Corsair H100i PRO RGB 240mm – buy from Amazon
- RAM: HyperX Fury RGB 32GB 3600MHz DDR4 – buy from Amazon
- SSD: Samsung 970 EVO Plus 2TB NVMe SSD – buy from Amazon
- PSU: Corsair RMx Series RM1000x Power Supply – buy from Amazon
- Monitor: Acer Predator XB271HK 4K G-Sync Monitor – buy from Amazon
- OS: Windows 10 Pro – buy from Amazon
- Drivers:
- NVIDIA – GeForce Game Ready Driver – 457.09 WHQL
- AMD – Adrenalin 2020 Edition 20.11.1 Optional
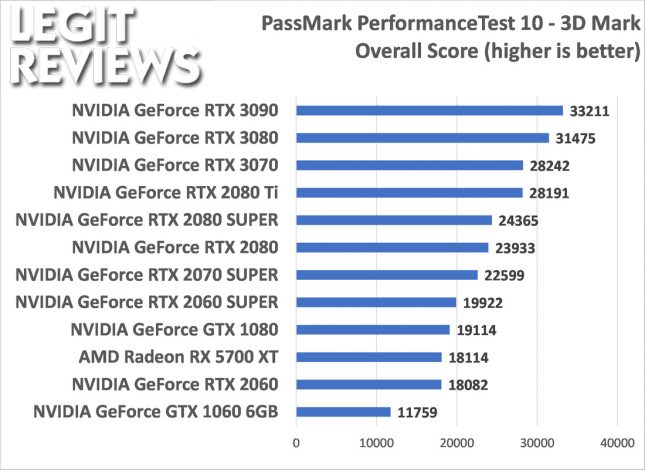
PassMark PerformanceTest 10 3D Mark Graphics Score
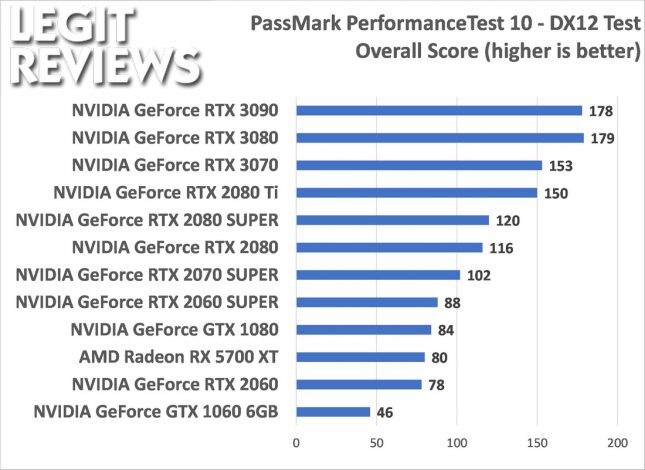
PassMark PerformanceTest 10 3D Mark Graphics DX12 Score
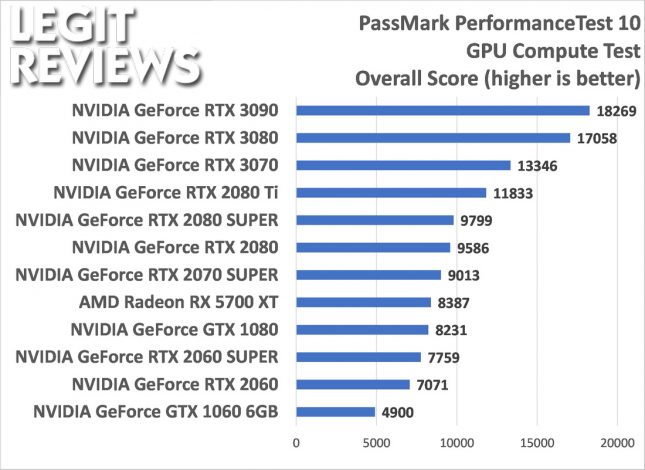
PassMark PerformanceTest 10 3D Mark Graphics GPU Compute Test
The results from the 3D Mark Graphics test in PerformanceTest 10 showed results that are pretty consistent to what we have seen on other benchmarks and real-world game titles. The overall score in 3D Mark shows pretty good scaling across the three generations of NVIDIA GeForce graphics cards that we tested.
The new NVIDIA GeForce RTX 3090 is the card to beat and was shown to be on top of the charts about 5.5% ahead of the NVIDIA GeForce RTX 3080. The GeForce RTX 3080 is shown to be roughly 11.4 % faster than the GeForce RTX 3070. The AMD Radeon RX 5700 XT came in below the NVIDIA GeForce GTX 1080, but was ahead of the GeForce RTX 2060 in the overall test.
Looking closer at the subtest scores we see that we seem to be CPU limited by our Intel Core i9-10900K processor on the DX12 test as both the GeForce RTX 3080 and GeForce RTX 3090 finished with the same basic results. The GPU Compute test showed some pretty nice scaling with the AMD Radeon RX 5700 XT being able to outperform the NVIDIA GeForce GTX 1080.
Final Thoughts on PerformanceTest 10
You can download PerformanceTest directly from PassMark and try out a feature limited trial version of the software for free. If you like it you can purchase a single user license for $29 that comes with 12-months of free upgrades and technical support. Now that we’ve tested a dozen graphics cards on this benchmark we plan on including it when we review AMD’s ‘Big Navi’ parts later this month. It will be interesting to see where the Radeon RX 6800 XT and Radeon RX 6800 graphics cards will end up in the charts!

