Best CPU For Gaming – Top 50 Steam Games Benchmarked
The Systems Used For Testing
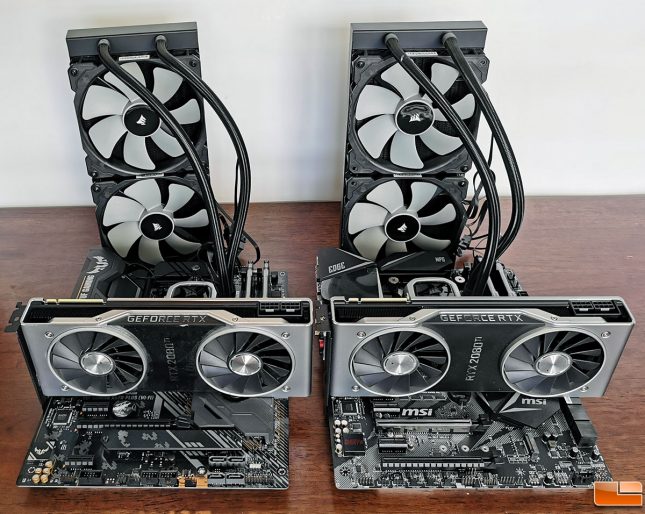
We built up two test systems that we thought would be fair for testing. To do this we used the same part number for the graphics card, AIO CPU liquid cooler, primary NVMe SSD, external game drive, power supply, DDR4 memory kit and the external game drive. The AMD system came out being about $250 more and that was mainly due to the fact the AMD Ryzen 9 3950X processor is higher priced. NVIDIA GeForce Game Ready 442.59 WHQL video card drivers were installed for each NVIDIA GeForce RTX 2080 Ti Founders Edition graphics card.
| Processor | AMD Ryzen 9 3950X | $737.99 | Intel Core i9-9900K | $500.00 |
| Motherboard | ASUS TUF Gaming X570-Plus (WI-FI) | $189.99 | MSI Z390 Gaming Edge AC | $179.82 |
| Video Card | GeForce RTX 2080 TI FE | $1,199.00 | GeForce RTX 2080 TI FE | $1,199.00 |
| DDR4 Memory (32GB) | HyperX Fury RGB 3733 | $231.00 | HyperX Fury RGB 3733 | $231.00 |
| NVMe SSD | WD_Black SN750 1TB | $166.39 | WD_Black SN750 1TB | $166.39 |
| CPU Liquid Cooler | Corsair H115i PRO RGB | $159.98 | Corsair H115i PRO RGB | $159.98 |
| Power Supply | Corsair HX1000 | $249.94 | Corsair HX1000 | $249.94 |
| External Game Drive | WD Black 12TB D10 | $259.99 | WD Black 12TB D10 | $259.99 |
| Total: $3,194.28 | Total: $2,946.12 |
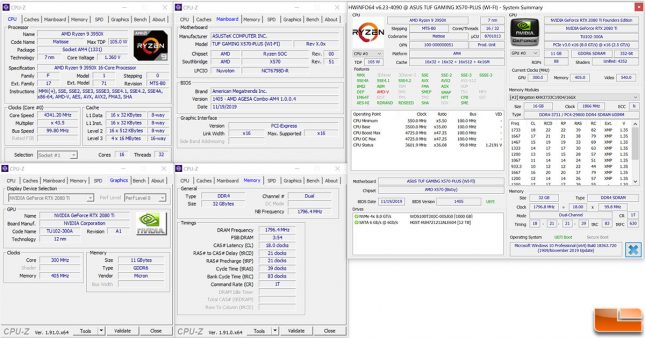
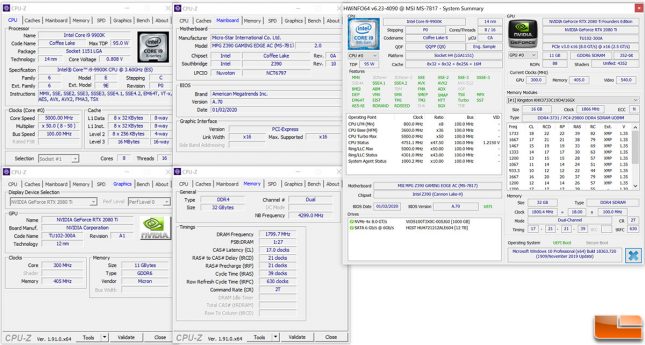
Both systems were loaded up with Windows 10 v1909 with all the latest updates and BIOS/UEFI revisions for when the testing was done. The HyperX Fury RGB DDR4-3733 Memory Kit was run with XMP Profile 2 enabled that set the memory to operate at 3600 MHz on both platforms. The AMD platforms infinity fabric (FCLK) was set to run at the advised 1:1 speed for best performance. The memory timings were not manually set as we were trying to mimic how most gamers would configure their platform.
Testing for this article spanned a solid month due to the complexity of testing, but each game was tested back-to-back as that was the only way to ensure the same game build was used. It also helped ensure that we ran the same exact path in the game as that can get complicated when manually benchmarking titles. Each benchmark was run five times and the average of each of the five runs will be used for the results to keep things simple. We won’t be showing the graphics settings used in this article, but we have uploaded a PDF to Dropbox that shows the image quality settings for each title tested.
AMD Ryzen 9 3950X Test Platform Details
Intel Core i9-9900K Test Platform Details
Let’s take a look at the benchmark results!


Comments are closed.