AMD A10-7870K Godavari APU Review
PCMark 8
We ran the PCMark 8 Home benchmark, which includes workloads that reflect common tasks for a typical home user. These workloads have low computational requirements making PCMark 8 Home suitable for testing the performance of low-cost tablets, notebooks and desktops. Home includes workloads for web browsing, writing, gaming, photo editing, and video chat. The results are combined to give a PCMark 8 Home score for your system.
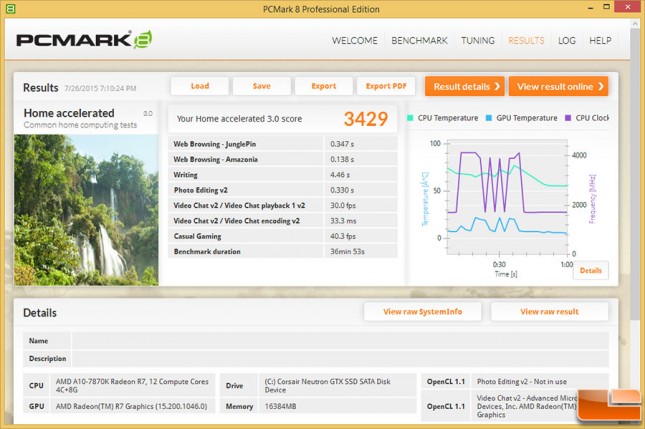
PCMark 8 Home Accelerated Test Results:
| G3285 | A8-7600 | A10-7800 | A10-7870K | 4770K | 4790K | 5775C | |
| Overall Score | 2555 | 3181 | 3322 | 3429 | 3449 | 3597 | 4462 |
| Web Browsing – JunglePin | 0.315s | 0.353s | 0.351s | 0.347s | 0.310s | 0.310s | 0.305s |
| Web Browsing – Amazonia | 0.134s | 0.139s | 0.139s | 0.138s | 0.134s | 0.134s | 0.133s |
| Writing | 3.95s | 4.79s | 4.72s | 4.46s | 3.46s | 3.14s | 4.40s |
| Photo Editing V2 | 0.704s | 0.331s | 0.304s | 0.330s | 0.350s | .321s | 0.128s |
| Video Chat Playback | 30 fps | 30 fps | 30 fps | 30 fps | 30 fps | 30 fps | 30 fps |
| Video Chat Encoding | 133.3ms | 49.7ms | 37.7ms | 33.3ms | 48.0ms | 43.0ms | 37.0ms |
| Casual Gaming | 23.0 fps | 34.8 fps | 35.1 fps | 40.3 fps | 35.9 fps | 36.4 fps | 67.1 fps |
Benchmark Results: The AMD A10-7879K completed the Futuremark PCMark 8 Home Accelerated benchmark test with an overall score of 3,429. If you look closely at the seven work traces used in that are tested you’ll see that the main performance boost came from the casual gaming benchmark and the video chat encoding test had strong results on this particular processor.

