Abit GeForce 4 Ti4200 OTES
Benchmarks & Performance:
Our Test System:
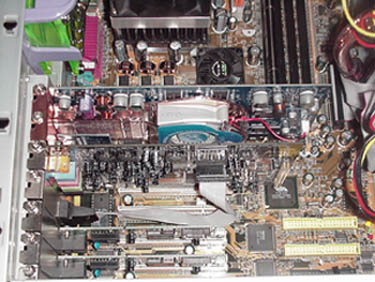
- AMD Athlon XP 1600+ (AGOIA stepping)
- Abit KX7-333R (Enhanced settings enabled in BIOS)
- Alpha PAL 8045 w/80cfm Delta (Air Cooled)
- 512mb Corsair XMS PC-3200C2 (CAS 2)
- Western Digital 30Gb ATA 100 7,200rpm
- Soundblaster Audigy X-Gamer
- Antec True Power 430W Power Supply
- ViewSonic E90fb Monitor
Testing Procedure:
All testing was done on a fresh install of Windows XP Professional build 2600. All tests were done on the desktop with no other software programs running. For overclocking the videocard we used the simple and free powerstrip program. During this review the room temperature was 24 degrees Celsius, while the case temperature was 28 degrees Celsius.
3dmark2001 SE 330:
3DMark2001SE build 330 is the latest installment in the 3DMark series by MadOnion. By combining DirectX8 support with completely new graphics, it continues to provide good overall system benchmarks. 3DMark2001SE build 330 was created in cooperation with the major 3D accelerator and processor manufacturers to provide a reliable set of diagnostic tools. It demonstrates 3D gaming performance by using real-world gaming technology to test a system’s true performance abilities. All tests were run at 1024×768 at 32 bit color.
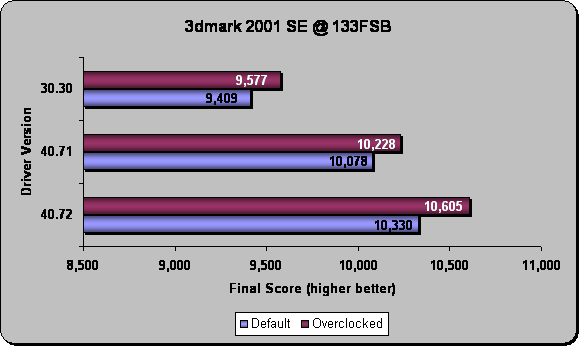
The first chart shows the results on our test rig at 133FSB.
This second chart shows the results on our test rig at 166FSB.
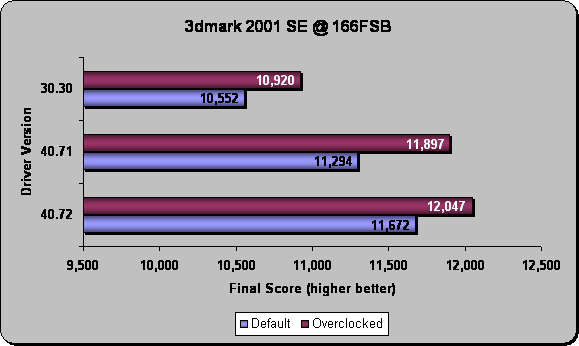
Results: 3DMark2001SE build 330 shows the benifits of running at a higher FSB of 166mhz. The gain was 1,342 points just by increasing the FSB. This shows us the performance gains that the Barton and future AMD processors will bring, since they will have a 166mhz FSB standard. Also it was determined by these tests that the 40.72 driver does work the best so the following benchmarks will use this driver. We also believe that a driver upgrade to 40.72 or higher would be a wise choice.
Chameleon Mark:
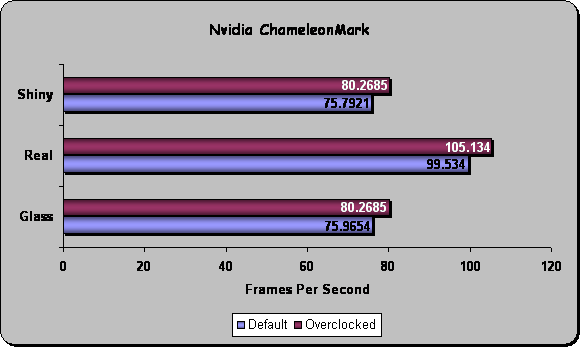
Chameleon Mark is not a brand new benchmarking utility, but it still shows a video cards true abilities. This benchmark is based upon the popular “Chameleon” demo released by NVIDIA with the introduction of the GeForce3 line of GPUs. Chameleon Mark is primarily used to measure pixel shader performance for a variety of shaders. Lets see how the OTES performs in Chameleon Mark at 1024×768 with the 4072 drivers:
Unreal Tournament 2003 Demo:
The Unreal Tournament 2003 Demo includes a benchmark program that automatically tests two separate modes. One is Flyby, which like the name indicates takes a tour of the UT game map and then offers up a framerate score. This really tests the how well the CPU and video card work. The second is Botmatch, and this is a more game-oriented test than Flyby, and is a far more CPU-oriented test.On this benchmark we tested UT 2003 at 1024×768 x 32-bit.
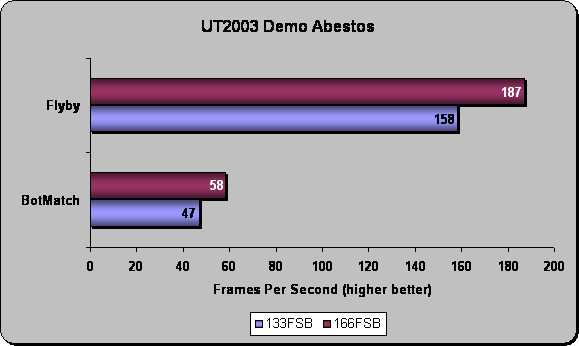
Results: We found it interesting that overclocking the OTES provided no increase at all in performance on this benchmark at either 133FSB or 166FSB, this shows that the benchmark is putting a heavy toll on the Athlon Processor and the bandwidth allowed for it to run.
That concludes our benchmarks we chose to do on the OTES series card. Let’s go on and see what are final thoughts on the card are.

Comments are closed.