G.SKILL Ripjaws 8GB 2133MHz DDR3L SO-DIMM Memory Kit Review – F3-2133C11D-8GRSL
DDR3L 2133MHz Memory Kit Benchmark Results:
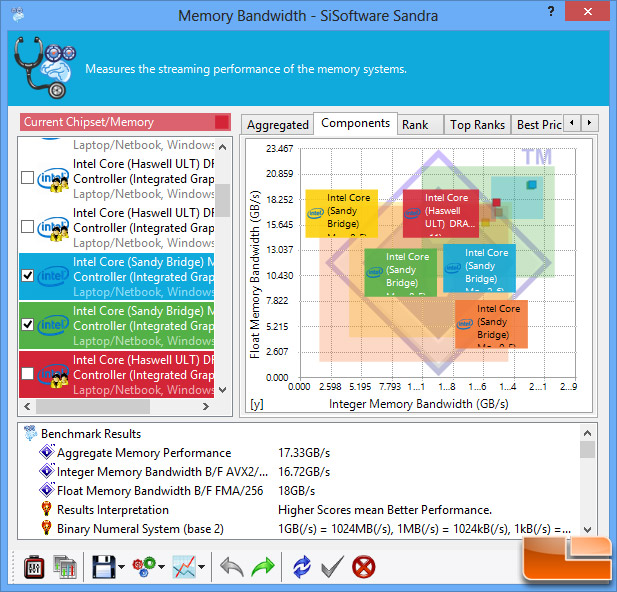
SiSoftware Sandra 2014 w/ DDR3L 1600MHz:
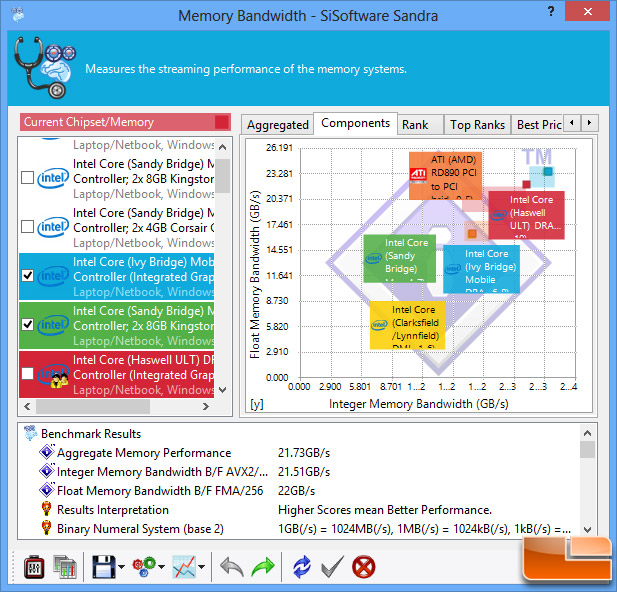
SiSoftware Sandra 2014 w/ DDR3L 1866MHz:
SiSoftware Sandra 2014 w/ DDR3L 2133MHz:
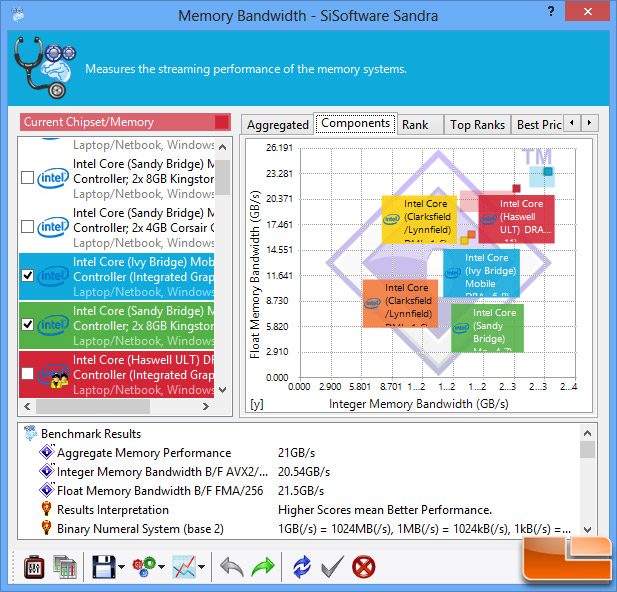
SiSoftware Sandra 2014 showed that the NUC went from having 17.33 GB/s of memory bandwidth at 1600MHz up to 21.73 GB/s with the 1866MHz kit and then it dropped down to 21 GB/s with the 2133MHz memory kit. We were expecting to see an increase in performance from 1866MHz to 2133MHz, but we actually saw a small decrease in memory bandwidth.
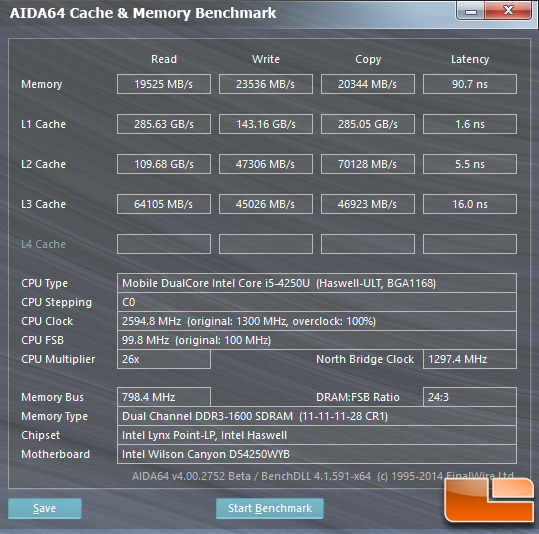
AIDA64 v4.00 Beta w/ DDR3L 1600MHz:
AIDA64 v4.00 Beta w/ DDR3L 1866MHz:

AIDA64 v4.00 Beta w/ DDR3L 2133MHz:
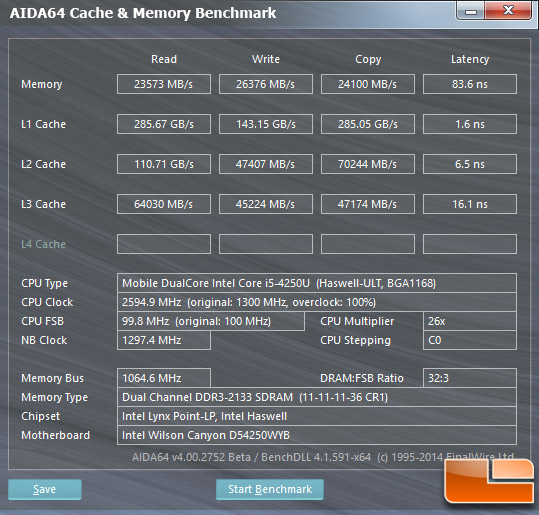
AIDA64 v4.00.2752 Beta showed the memory read went from 19525 MB/s to 23573 MB/s, which is a 14% increase in memory performance by going from 1600MHz to 2133MHz. Also notice the latency went from 90.7 ns to 83.6 ns, which is a 7.8% decrease. The performance differences between 1866MHz and 2133MHz are fairly minor once again.
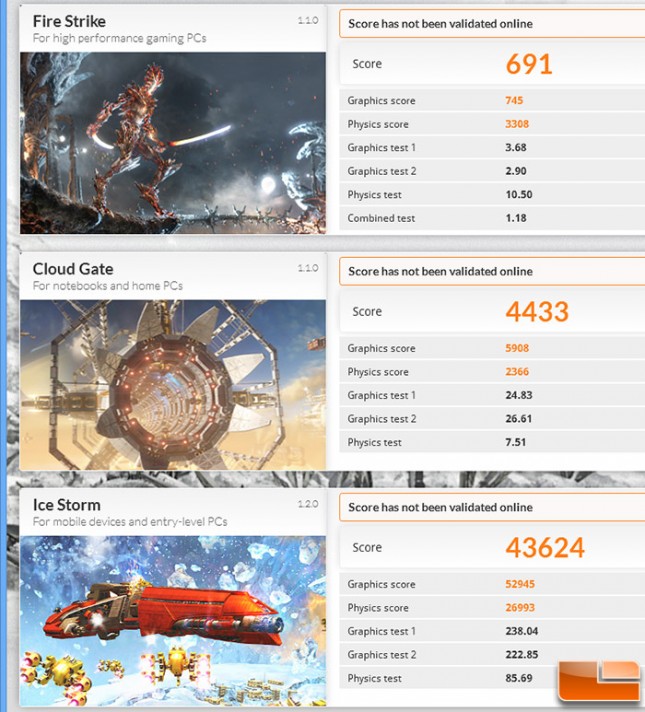
Futuremark 3DMark w/ DDR3L 1600MHz:
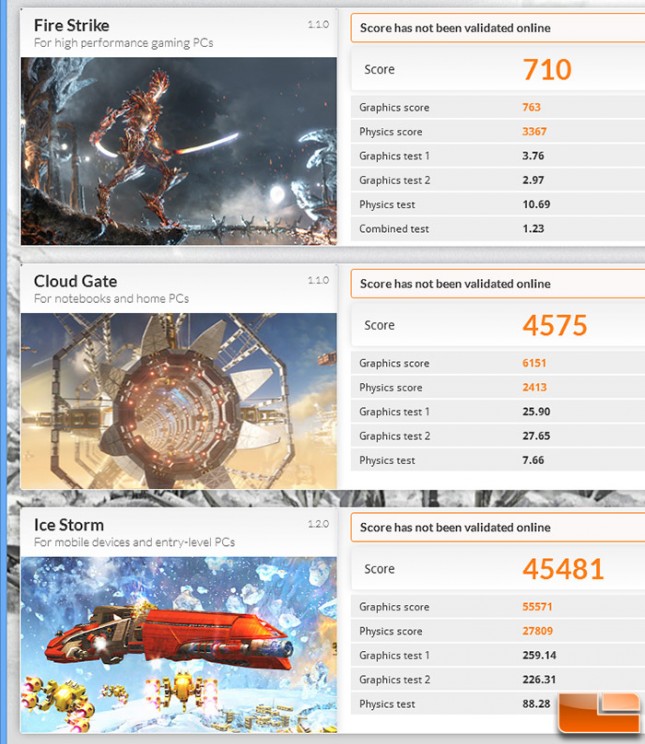
Futuremark 3DMark w/ DDR3L 1866MHz:
Futuremark 3DMark w/ DDR3L 2133MHz:

In the latest build of 3DMark we found solid performance with a score of 43,624 in Ice Storm with 1600MHz memory, 45,481 with 1866MHz memory and finally 46,804 with 2133MHz memory. The scores went from 702 in Fire Strike with 1600MHz memory, 710 with 1866Mhz memory and 758 with 2133MHz memory. This is a 7.2% performance gain in Cloud Gate, which is the ideal 3D benchmark for a desktop system like the NUC with Intel HD 5000 Graphics. The performance between running the memory at 1866MHz and 2133MHz was found to be 2.9%.
Cinebench R15 w/ DDR3L 1600MHz:

Cinebench R15 w/ DDR3L 1866MHz:
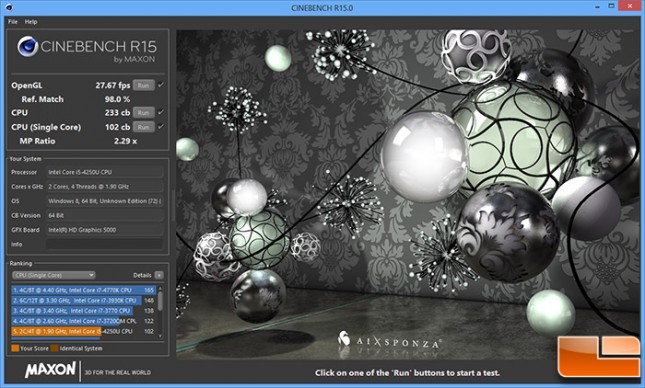
Cinebench R15 w/ DDR3L 2133MHz:
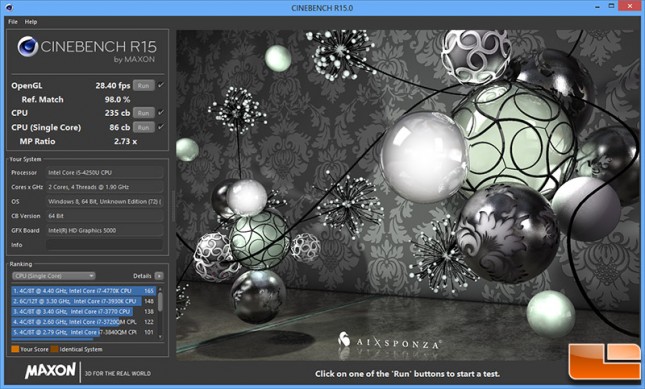
Moving along to Cinebench R15 we found the Intel NUC with the Intel Core i5-4520U processor scored just a tad higher on the CPU test, but the Intel HD Graphics 5000 jumped up from 25.06 FPS to 28.40 FPS on the OpenGL benchmark. It should be noted that single core CPU performance was significantly degraded with the 2133MHz memory kit installed and we have reached out to Intel to see what could be causing this and they are looking into it as well. We’ll take a 13.3% performance gain on the graphics side by switching out a memory kit any day!
TrueCrypt w/ DDR3L 1600MHz:

TrueCrypt w/ DDR3L 1866MHz:
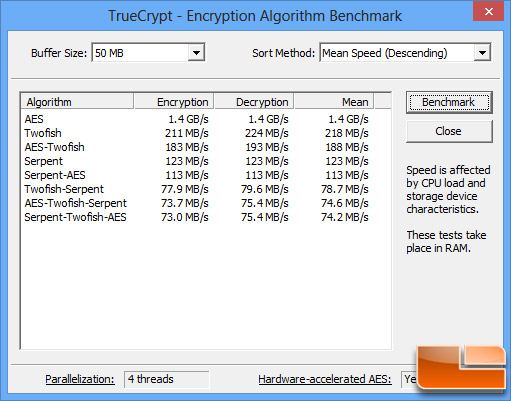
TrueCrypt w/ DDR3L 2133MHz:
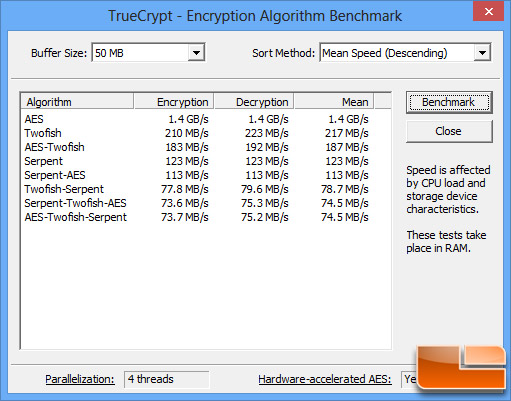
The last performance test that we wanted to run was TrueCrypt and we found the mean score of the AES algorithm benchmark test went from 1.3 GB/s to 1.4 GB/s. This isn’t a huge increase, but it’s still a 7.7% performance gain on a test that isn’t really memory bandwidth limited to begin with.