AMD Ryzen Balanced Power Plan Benchmarked
AMD Ryzen Windows Power Plan Disables Core Parking
Earlier this morning we were surprised with an e-mail from AMD offering a preview of a new Ryzen Balanced power plan for Windows that is said to improve performance on Ryzen processors. We pushed some of the things we were working on today off the agenda and started testing the new Ryzen Power Plan to see what performance gains were to be had. So, with a clean install of Windows 10 you get three plans from Microsoft, but you have the ability to create and add a custom power plan if you want to.
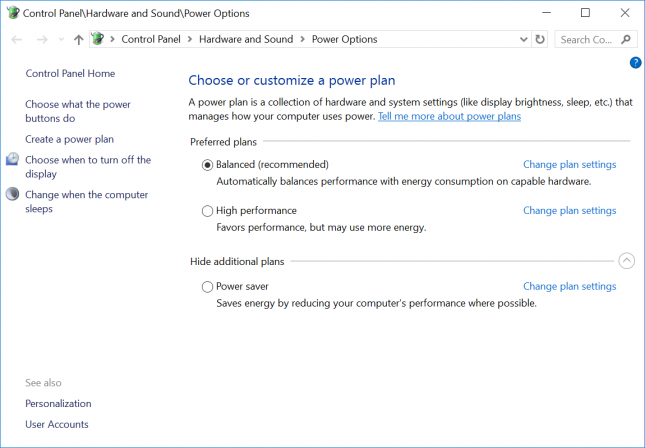
- Balanced – The default Windows 10 power plan that offers full performance when you need it and saves power when you don’t.
- Power saver – Saves power by reducing PC performance by lower clock speeds, screen brightness and through additional tweaks.
- High performance – Doesn’t lower the CPU clock speed when it isn’t being used for maximum performance, keeps other components from entering power-saving mode without worrying about power consumption.
- Custom power plan – Microsoft allows PC manufacturers (OEM) or anyone that wants to create an additional power plan to create a custom power plan.
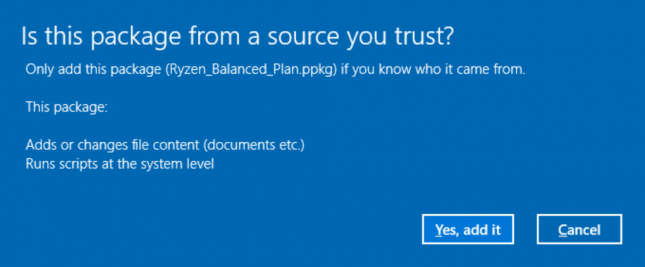
AMD came up with their own power plan and packaged it as a standalone installer (ppkg) that you can download and use right now. To install it on our Windows 10 system we just needed to allow the package to run on our system due Windows UAC alert and that was it.
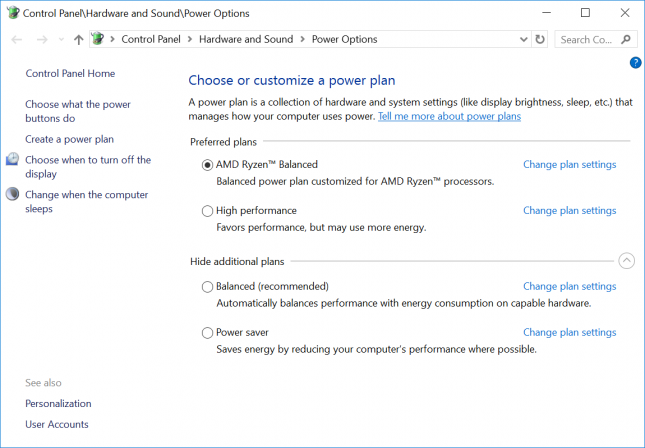
Once we went back into the Power Options on our test system there was a new AMD Ryzen Balanced Power Plan to choose from and it was automatically selected by default. This is nice as once it is installed you can just clock the power plan you want and quickly test the differences between the AMD Ryzen Balanced power plan and the default Balanced and High Performance plans.
AMD informed Legit Reviews that they will be placing this power plan into the AMD chipset driver package shortly. They said that it will replace the Balanced plan that comes with Windows, and be set as the new setting for users with AMD Ryzen CPUs. What makes this power plan so special? Here are the two big changes that AMD did, but you can get more details from their blog post.
- Maintain residency in CPU P0 or P1 to give Zen full control over clocks and volts.
- Disable core parking.
Why does this matter? On Windows 7 the OS keeps all physical cores awake, and parks SMT cores. Those running Windows 10 will find that the OS keeps one physical and one logical core away (Core0+1), then parks the rest as often as possible. This difference alone is whats responsible for the cases online where some sites and users have said Windows 7 was faster than Windows 10 with regards to gaming performance. It was not the scheduler as the community thought at first. It should also be noted that Intel fully disables core parking in their own custom Balanced power plan. So, the secret sauce with this new power plan is disabling core parking! AMD sent over the following benchmark results that they came up with internally and the results look pretty damn impressive as you can see in the table below.
| GAME | RES | Uplift of AMD Plan vs. Balanced (Win10 Default) |
| Battlefield One: Ultra (DX12) | 1920x1080x32 | 10.77% |
| Battlefield One: Ultra (DX11) | 1920x1080x32 | 5.66% |
| Mafia 3: High (DX11) | 1920x1080x32 | 5.26% |
| Gears of War 4 Ultra | 1920x1080x32 | 16.50% |
| Rise of the Tomb Raider: Veryhigh (DX12) | 1920x1080x32 | 4.10% |
| Total War Warhammer: Ultra (DX12) | 1920x1080x32 | 5.34% |
| Total War Warhammer: Ultra (DX11) | 1920x1080x32 | 3.33% |
| Mirrors Edge Catalyst: Ultra | 1920x1080x32 | 4.81% |
| Dota 2: Ultra (DX11) | 1920x1080x32 | 6.33% |
| Batman Arkham Knight | 1920x1080x32 | 4.61% |
| Overwatch: Epic (Russia) | 1920x1080x32 | 5.10% |
| Overwatch: Epic (Hollywood) | 1920x1080x32 | 4.45% |
| Overwatch: Epic (Numbani) | 1920x1080x32 | 4.71% |
| Battlefield 4 (Airfield) | 1920x1080x32 | 3.41% |
| Battlefield 4 (Dam) | 1920x1080x32 | 8.75% |
| Battlefield 4 (Naval) | 1920x1080x32 | 10.07% |
| Call of Duty Advanced Warfare | 1920x1080x32 | 7.11% |
| Murdered Soul Suspect: High | 1920x1080x32 | 14.83% |
| Watch Dogs: Ultra | 1920x1080x32 | 11.89% |
| Watch Dogs: High | 1920x1080x32 | 12.12% |
| Thief: Preset Very High | 1920x1080x32 | 3.68% |
| Thief: Preset Normal | 1920x1080x32 | 7.96% |
| Shadows of Mordor: Very High | 1920x1080x32 | 6.08% |
| GTA V: Max | 1920x1080x32 | 4.44% |
| Far Cry 4: Ultra | 1920x1080x32 | 3.72% |
| Project Cars: Ultra | 1920x1080x32 | 9.03% |
| Alien Isolation | 1920x1080x32 | 8.52% |
| Crysis 3 (Jailbreak) | 1920x1080x32 | 21.56% |
| Bioshock Infinite: Ultra (DX11 DDOF) | 1920x1080x32 | 4.27% |
| Bioshock Infinite: Ultra (DX11) | 1920x1080x32 | 7.87% |
AMD internal benchmark results are always fun to look at, but we like doing on our testing and that is exactly what we did today.
That said, let’s look at the test systems and then jump into our independent benchmark results.


